 Algeria Agency
Demonstration · Data analysis
Boutique Nesma: the dashboard that reconciles three sources and knows when to say nothing
An invented online shop in Oran, three tools giving three figures for the same month, and the dashboard that reconciles them, draws four decisions and declines to conclude without the data.
Try it yourself
Boutique Nesma
Three tools, one month, and a dashboard that refuses to conclude.
- Service shown
- AI analytics & dashboards
- Sector
- Clothing
The shop does not exist and the figures are made up. What is real is how they are handled — including the two refusals, which are the part an ordinary dashboard never shows you.
Boutique Nesma is an online shop that does not exist. We invented it in Oran, with twelve weeks of fabricated orders, to show what an Algerian retailer can have instead of a screen of forty indicators: a dashboard that brings its tools into agreement, says which one governs, and stops where the figures no longer allow a conclusion.
The screenshots below come from the demonstration itself and are retaken automatically after every change. No order, customer or figure in it is real, nothing is sold or collected, and nothing you do in the demonstration is kept.
Every functionality
15 functionalities
Three sources
The reconciliation
The decisions
Left to a person
Refusals and questions
On a phone
Trying it in a few minutes
Look at the three figures
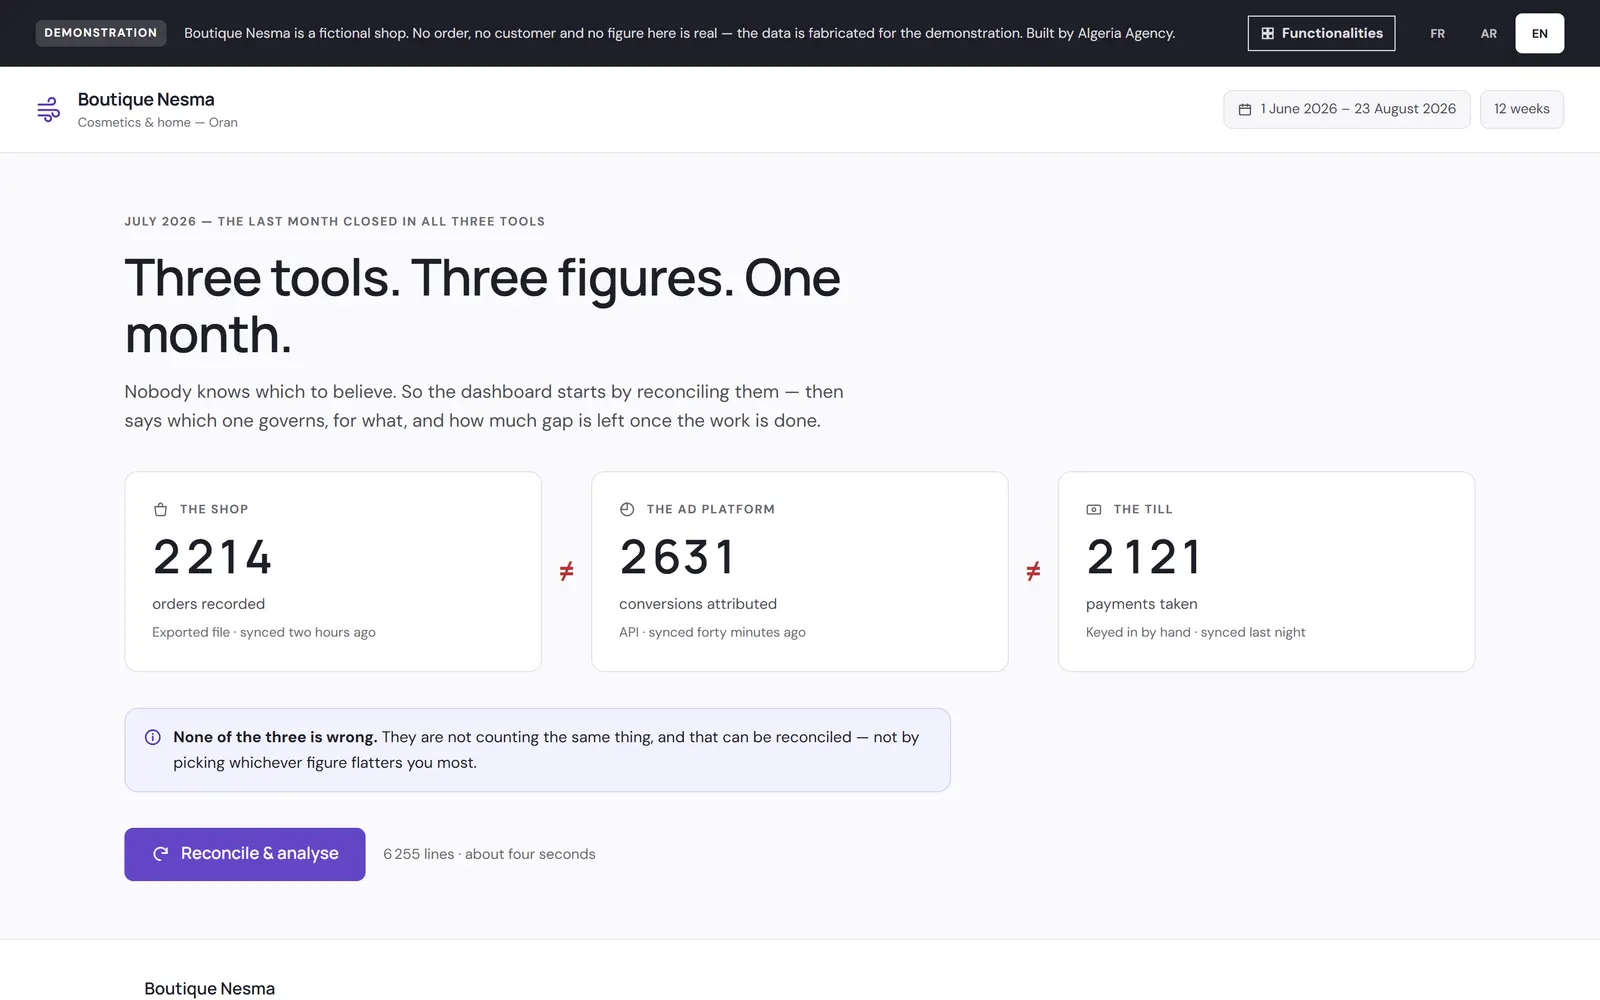
The screen opens on the same month as seen by three tools that do not agree.
Run the reconciliation
Press “Reconcile & analyse”: within seconds the stages run and the dashboard explains what it changed and what it set aside.
Open a decision
On a card, choose to show the lines and read the orders or return reasons that produced the figure.
Scroll down to the refusals
Read why two decisions are waiting for a person and why the dashboard shows no forecast.
Frequently asked questions
Is Boutique Nesma a real shop?
No. The shop, its orders, customers, carriers and figures are fabricated for the demonstration. Oran and the wilayas named are real. What is real is the way the data is handled, refusals included.
Are the figures on screen client results?
No. They are invented data, so that the demonstration has something to reconcile. They describe neither an existing shop nor what a dashboard would bring yours.
Is anything bought or recorded?
No. The demonstration takes no order and collects nothing, and it keeps nothing of what you do in it. Only the question box calls a model, with your sentence and nothing else.
Can my shop have the same dashboard?
Yes, built for it: connected to its own exports, ad platform, till and carriers, with the decisions that matter to its trade. We do not resell this demonstration; we build yours.
Why a dashboard that refuses to answer?
Because a figure on screen will be believed and used to decide. When the data cannot carry a forecast or an attribution, saying so is more useful than drawing a convincing curve. The screen also says what would need collecting before it could answer.
How to start
Open the demonstration and press the reconcile button: four seconds later you are reading the decisions, their lines and the two refusals.
If your tools give figures that do not agree, write to us: we look together at your sources and at what should be reconciled before anything is measured.
Let’s find where your next customers will come from
Tell us where things stand — your ads, your website, your Google listing — and what you are after. We reply within one working day, and the conversation commits you to nothing.